Vol. 3 (2020), Article ID 246103, 4 pages
Research Article
Evaluation of Zirconia Nanofiller and Brass Alloy Assembly by X-Ray Radiography
A. Kadhim
Laser and Optoelectronic Engineering Department, University of Technology, Baghdad 10001, Iraq
Received 7 June 2020; Revised 6 August 2020; Accepted 28 August 2020; Published 6 October 2020
A. Kadhim, Evaluation of Zirconia Nanofiller and Brass Alloy Assembly by X-Ray Radiography, Journal of Transition Metal Complexes, 3 (2020), art246103. doi:10.32371/jtmc/246103
Zirconia samples were linked with brass alloy using different nanofiller types. These nanofillers were formed with different concentrations of copper, silver, and titanium nanopowder metals. They were prepared by mixing powders, compacting them by pressure, and sintering them by tube furnace with argon atmosphere at 1200 °C for
50 min. Zirconia/brass assemblies were joined in a vacuum furnace with the pressure of 2 × 10⁻⁵ torr at 900 °C for 15 min. X-ray radiography was used to evaluate and detect the defect in the contact area. Some defects were detected. The shear test was achieved to determine the joint strength. Finally, a relationship was found between X-ray radiography and the shear test.
radiography; zirconia; nanofiller; brass alloy
Lap joints between ceramic (zirconia) and brass alloy have become very important in the production of electronic components and other high-tech products [1,2]. The association of ceramics with the metal is the result of chemical and physical reactions in very thin interfaces, and most ceramics are made to binding at a high temperature, where the chemical reaction is expected to happen [3,4,5]. One of the sources of pressure in the ceramic-to-metal joint is the variation of the thermal expansion of the materials. These sources are involved even if the materials are chosen for closely similar expansion coefficients over a wide range of temperatures. This case is called “identical seals,” while if the materials have a different expansion coefficient then the seal is called an “unparalleled seal” [6,7]. The heat capacity between metal and ceramics makes it virtually impossible to obtain a true identical seal. The following principles must be taken into account as well, and then the expansion match is good. The zirconia part should be designed with a thickness good enough to withstand pressure and mechanical procedures. The expansion coefficient of the joint fastening must be maintained near the ceramic part [8,9].
The wettability of materials by active nanofiller is indicated by the contact angle (θ) shown in Figure 1. The contact angle depends on the surface’s roughness. When (θ) is greater than 90°, the liquid is considered to be nonwetting, while a (θ) less than 90° is associated with a liquid that wets the surface contact [10,11,12]. The wetting is a physical process which is controlled by interfacial energy acting between the surfaces of the materials, the body of the melt, and the ambient gas according to the Young equation as follows:
|
|
(1) |
where γsv, γls, and γlv are the interfacial free energies for the boundaries between the phases solid (s), liquid (l), and vapor (v), respectively.
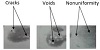
Figure 1: Radiograph of lap joint defects.
The properties of an alloy used for joining zirconia to brass must have some factors such as having the ability for bonding and wetting the surface, being ductile, and having a low melting point, low vapor pressure, and thermal expansion that accommodate with ceramic and metal. The filler should have the ability for oxidation and corrosion resistance. The alloy of Ag-Cu that has a low melting point was selected. Copper is highly soluble in silver and the melting point of the alloy is lower than that of the melting points of ceramic and brass [13,14]. Titanium is commonly used to join metals and ceramic by using active nanofillers and can take considerable oxygen into solution and form as a family of oxides whose chemistry depends on the activity of oxygen [15,16,17].
Ceramic is one of the oldest technologies with a history of about 1,000 years behind it [18]. The properties of the
ceramic are high thermal and electrical resistivity, high mechanical strength, a wide range of thermal expansion, no special annealing required, low vapor pressure, and good chemical stability. The pure alumina is a common type of ceramics and the increased purity makes alpha (α) type, increased strength, and higher electrical resistivity [19].
Brass is usually the first-choice material for many of the components for equipment made in general, electrical, and precision engineering industries. Brass is specified because of the unique combination of properties, matched by no other material, that make it indispensable where a long, cost-effective service life is required. We can take the brass compound as evidenced by our mission a practically boundless limit for cold work. One extraordinary element of the greater part of these composites is being erosion safe in few atmospheres. The utilizations of Cu alloys include adornments, coins, hardware, springs, shrubberies, surgical, and dental instruments, radiators, and so on [20,21,22,23].
Radiography is a well-established nondestructive testing (NDT) method for obtaining information about discontinuities through the specimen [23,24,25]. The radiography is performed by placing a photograph film amount in a light-tight holder as close to the joint as possible and then irradiating the assembly from the opposite side with an X-ray source. The radiography method is generally used for the successful detection of internal flows that are located well below the surface and their interaction with any substance. The interaction of X-rays with the examined parts shows defects in these parts due to the difference in absorption of X-rays by defects and the parts without defects. This behavior is expressed according to the following equation [25,26,27,28]:
where I and I0 are the function of exposure time (t) and the operation current (i), respectively, and since t and I are fixed, then I proportional with D and I0 proportional with D0, where D is the optical film density at the radiograph and D0 is the optical film density at the background and thus
The radiographic interpreter is looking for the change that may be caused by one of three factors, namely, a change in the thickness of the test piece, an internal defect, and a density change which may be induced by faulty processing and it is important that the interpreter can assess the nature and the cause of each density difference observed. The radiograph should be viewed in a darkened room so that there will be a light reflection from the surface film. The radiograph reveals three types of flows [29,30] as shown in Table 1.
Table 1: The main defect type revealed in the radiograph.
Each brass sample was the first edge freed from burrs followed by polishing with metallographic paper and then by chemical cleaning [29,30].
The samples should be free from any contamination. A chemical procedure is done by immersing the samples in acetone for 20 min, followed by immersing them in dilute nitric acid for 5 min, and then rinsing them in distilled water. Finally, the samples were fired in the air at 1,100 °C for 1 h.
Active nanofiller samples were formed from Ag, Cu, and Ti with the specification illustrated in Table 2. The active filler was formed by using a stainless steel die with an inner diameter of 5 mm to compact green pellets using a hydraulic press with 10,000 N force and the sintering was carried out with tube furnace in an argon atmosphere at 1,100 °C for
60 min.
Table 2: Nanofiller composition.
This method was performed by placing an X-ray film amounted in a light-tight holder close to the joint region and irradiating it from the opposite side. The X-ray system is combined with a control unit. The main characteristics involved a tube voltage of 150 kV, tube current of 5 mA, anode type is tungsten, a focal spot size of 1.5 mm, and an exposure time of 5 min.
Joining brass to zirconia using different active nanofillers as shown in Table 2 has been carried out in a vacuum furnace with a joining temperature of 900 °C, joining time of 20 min, and a vacuum pressure of 2 × 10⁻⁴ torr. Shear tests were conducted as destructive testing for joining samples. This was designed to evaluate the strength of joining between brass and zirconia. The tensile machine was used to measure the fracture stress at a constant crosshead speed of 3 mm/min. The lap joint strength (in Mpa) was conducted from the force at fracture point in (N) divided by fracture area (m2).
Three types of defects were noticed, namely, cracks, voids, and nonuniformity of nanofiller distribution in the contact area. Typical radiographs are shown in Figure 1, which reveal these defects for active filler alloys. Table 3 summarizes the observed defects in all the joined samples. Voids density was determined as total voids presented in the contact area. Voids depend on Ti concentration in nanofillers, higher voids density were found in nanofillers with higher Ti concentration (Ti (wt%) > 2). Figure 2 shows the behavior density of voids with Ti concentration. This result is consistent with what was stated in [30].
Table 3: Radiographic results for brass/zirconia assemblies.
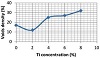
Figure 2: Voids concentration in lap joint versus Ti concentration.
The average fracture stress obtained for all joint samples is shown in Table 4. These results are plotted versus Ti concentration as shown in Figure 3. Brass was joined strongly to zirconia and this may be due to the effect of matching in the thermal expansion coefficient of these systems with all types of nanofillers. The effect of Ti concentration appears to be very critical, only about 2 wt% for the joint to acquire the maximum fracture stress at different nanofiller types, since nanofillers with low Ti concentration show voids density as shown in Figure 2. This may be due to the reduction in the oxidation of brass and nanofiller surfaces. The results obtained for destructive and nondestructive tests (as nonuniformity and voids density) were correlated in Figures 4 and 5. The joining strength decreases exponentially with increasing nonuniformity and voids density. It seems to be that the maximum allowable nonuniformity and voids density in the lap joint equal to 25% since they will produce a suitable joint strength. This is the maximum allowable nonuniformity and voids density. The values of joint strength are better than the results obtained in [30]. This is because in this work we used nanofillers while in [30] they used a microfilter.
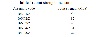
Table 4: Joint strength measurements.
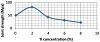
Figure 3: Joint strength (Mpa) versus Ti concentration (wt%).
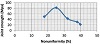
Figure 4: Joint strength (Mpa) as a function of nonuniformity (%).
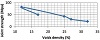
Figure 5: Joint strength (Mpa) as a function of voids (%).
Brass-to-zirconia joined samples contain three types of defects with different percentages as shown by the X-ray radiography technique, which represents a suitable NDT for zirconia to brass lap joining system. Samples joined with active nanofiller type (Ag (65%) + Cu (33%) + Ti (2%)) reveal a minimum defect in lap joint contact and a maximum joint strength while the nanofiller type (Ag (48%) + Cu (44%) + Ti (8%)) reveals a maximum defect in lap joint contact and a minimum joint strength. The effect of defect type crack and voids density on a lap joint strength is higher than the effect of nonuniformity defect.
The author declares that he has no conflict of interest.
- J. Intrater, The challenge of bonding metals to ceramics, Machine Design, 61 (1989), 95–100.
- W. M. Shakier, A. Kadhim, and A. Z. Mohammed, Corrosion inhibitor for st-37 alloy by laser shock peening technique, J Adv Electrochem, 2 (2016), 56–59.
- A. Roth, Vacuum Sealing Techniques, Pregamon Press, Oxford, 1st ed., 1966.
- R. S. Jawad, A. Kadhim, S. M. Fayadh, and T. K. Abed, Improvement of the fatigue resistance and increase its life of specimens of naval brass alloy using laser shock wave processing, J Nanosci Technol, 2 (2016), 69–72.
- A. Kadhim, R. S. Jawad, N. H. Numan, and R. J. Al-Azawi, Determination the wear rate by using XRF technique for kovar alloy under lubricated condition, Int J Comput Appl Sci, 2 (2017), 1–5.
- D.M. Jamil, A. K. Al-Okbi, S. B. Al-Baghdadi, A. A. Al-Amiery, A. Kadhim, T. S. Gaaz, et al., Experimental and theoretical studies of Schiff bases as corrosion inhibitors, Chem Cent J, 12 (2018), 7.
- S. M. Faydh, A. Kadhim, and E. T. Salim, Effect of the laser shock processing on wear resistance of brass alloy, Eng Technol J, 32 (2014), 998–1008.
- A. Feng, B. J. McCoy, Z. A. Munir, and D. Cagliostro, Wettability of transition metal oxide surfaces, Mater Sci Eng A, 242 (1998), 50–56.
- A. K. Judran, S. M. Kadhim, and H. Abdul Elah, Enhancement of the corrosion resistance for 6009 aluminum alloy by laser treatment, Kufa J Eng, 9 (2018), 201–214.
- A. Tomsia, Ceramic/metal joining for structures and materials, J Phys IV, 3 (1993), 1317–1326.
- Z. A. Sarkiss, Fracture and surface analysis of powdered glass – metal joined interface, PhD thesis, Baghdad University, 1997.
- M. O. Hashim, R. Al-Azawi, and A. Kadhim, The Q-switched Nd:YAG laser shock processing effects on mechanical properties of C86400 Cu-Zn alloy, Iraqi J Phys, 17 (2019), 136–140.
- H. Mizuhara, E. Huebel, and T. Oyama, High-reliability joining of ceramic to metal, Am Ceram Soc Bull, 68 (1989), 1591–1599.
- R. H. Abass, A. M. Haleem, M. K. Hamid, A. Kadhim, and R. S. Jawad, Antimicrobial activity of TiO2 NPs against Escherichia coli ATCC 25922 and Staphylococcus aureus ATCC 25923, Int J Comput Appl Sci, 2 (2017), 6–10.
- M. Koyama, S. Arai, S. Suenaga, and M. Nakahashi, Interfacial reactions between titanium film and single crystal α-Al2O3, J Mater Sci, 28 (1993), 830–834.
- A. Kadhim, S. M. Kadhim, and H. A. Abdul Jalil, A study of LSP
technique effect on the wear resistance for aluminum and copper alloys, in 4th Electronic and Green Materials International Conference 2018, vol. 2045, Bandung, Indonesia, 2018.
- D. Mohammed, A. Kadhim, and M. Fakhri, The enhancement of the corrosion protection of 304 stainless steel using Al2O3 films by PLD method, in 4th Electronic and Green Materials International Conference 2018, vol. 2045, Bandung, Indonesia, 2018.
- D. Mohammed, M. Fakhri, and A. Kadhim, Reduction the
corrosion rate of 304 stainless steel using pulsed laser shock penning method, in IOP Conference Series: Materials Science and Engineering, vol. 454, IOP Publishing, 2018.
- ASTM F15-04, Standard specification for iron-nickel-cobalt sealing alloy, ASTM International, West Conshohocken, PA, 2017.
- M. Jabbar, F. T. M. Noori, and A. Kadhim, Synthesis, characterization AC electrical properties of Cd doped with nano nickel ferrite by Sol-Gel, IOSR Journal of Applied Physics, 8 (2016), 65–70.
- G.W. Powell, S. E. Mahmoud, and American Society for Metals, Metals Handbook, vol. 11 of Failure Analysis and Prevention, ASM International, Almere, Netherlands, 9th ed., 1986.
- A. Kadhim, Experimental investigation for corrosion inhibition
of mild steel in hydrochloric acid bath by 3-[(5-phenyl-1,3,-thiadiazol-2-yl)imino]-2-oxoindoline, J Mater Sci: Mater Electron, 29 (2018), 4683–4688.
- Y. Segal and F. Trichter, Limitations in gap width measurements by X-ray radiography, NDT Int, 21 (1988), 11–16.
- International Scientific Association, Eurotest Technical Bulletin, 2nd ed., 1985.
- ASTM E390-15, Standard reference radiographs for steel fusion welds, ASTM International, West Conshohocken, PA, 2015.
- ASTM F19-11, Standard test method for tension and vacuum testing metallized ceramic seals, ASTM International, West Conshohocken, PA, 2016.
- A. Kadhim, L. A. Hameed, and R. S. Jawad, Spectral study of some pharmaceuticals and cosmetics, Eng Technol J, 33 (2015), 172–177.
- A. Kadhim, E. Salim, S. Fayadh, A. Al-Amiery, A. Kadhum, and A. Mohamad, Effect of multipath laser shock processing on microhardness, surface roughness, and wear resistance of 2024-T3 Al alloy, ScientificWorldJournal, 2014 (2014), 490951.
- S. Junaedi, A. A. Al-Amiery, A. Kadihum, A. H. Kadhum, and A. Mohamad, Inhibition effects of a synthesized novel 4-aminoantipyrine derivative on the corrosion of mild steel in hydrochloric acid solution together with quantum chemical studies, Int J Mol Sci, 14 (2013), 11915–11928.
- A. Jedran, Z. Sarkiss, and S. Hussain, X-ray radiography of alumina to kovar joining, Eng Technol J, 26 (2008), 520–527.
Copyright © 2020 A. Kadhim. This is an open access article distributed under the terms of the Creative Commons Attribution License, which permits unrestricted use, distribution, and reproduction in any medium, provided the original work is properly cited.