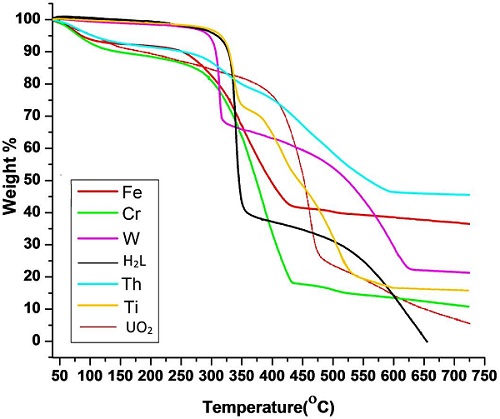
Figure 8:
TG curve of ligand and its metal complexes.