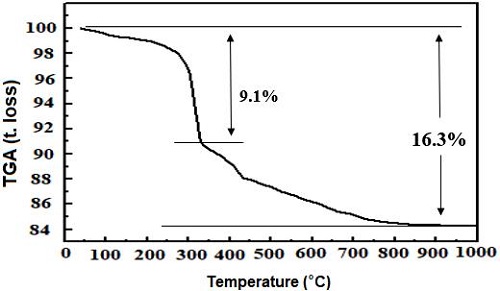
Figure 5:
Typical TGA analysis curves of the Nd
2
O
3
sample.