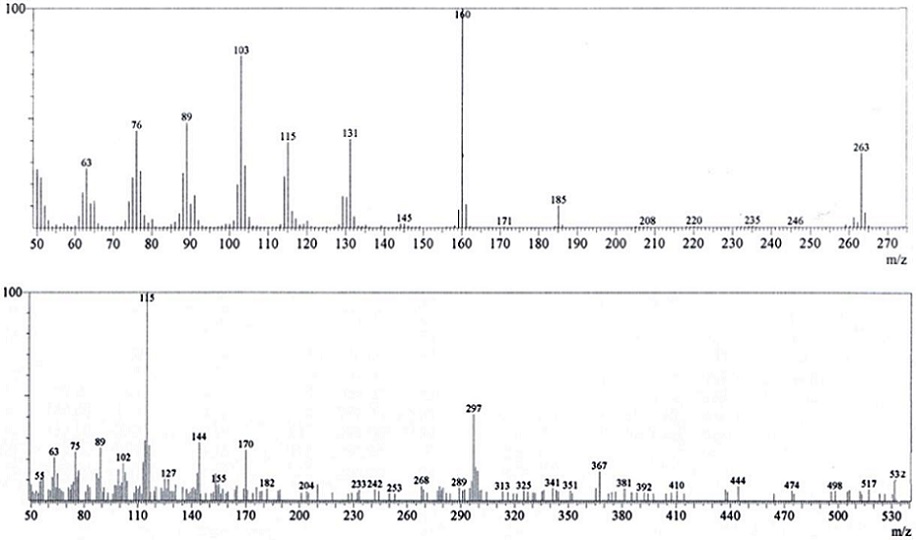
Figure 1:
Mass spectrum of L-Schiff base (upper) and complex (lower).