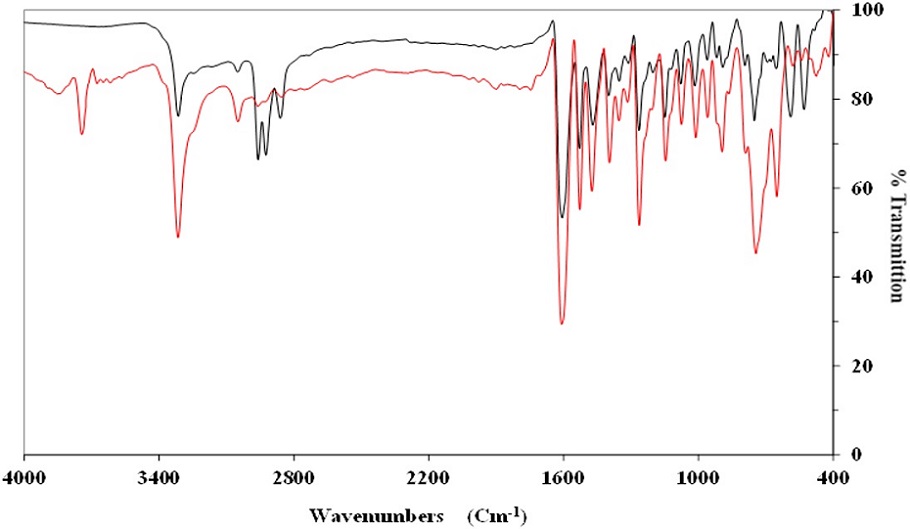
Figure 2:
FTIR spectra of L (red) and DBT-L complex (black).