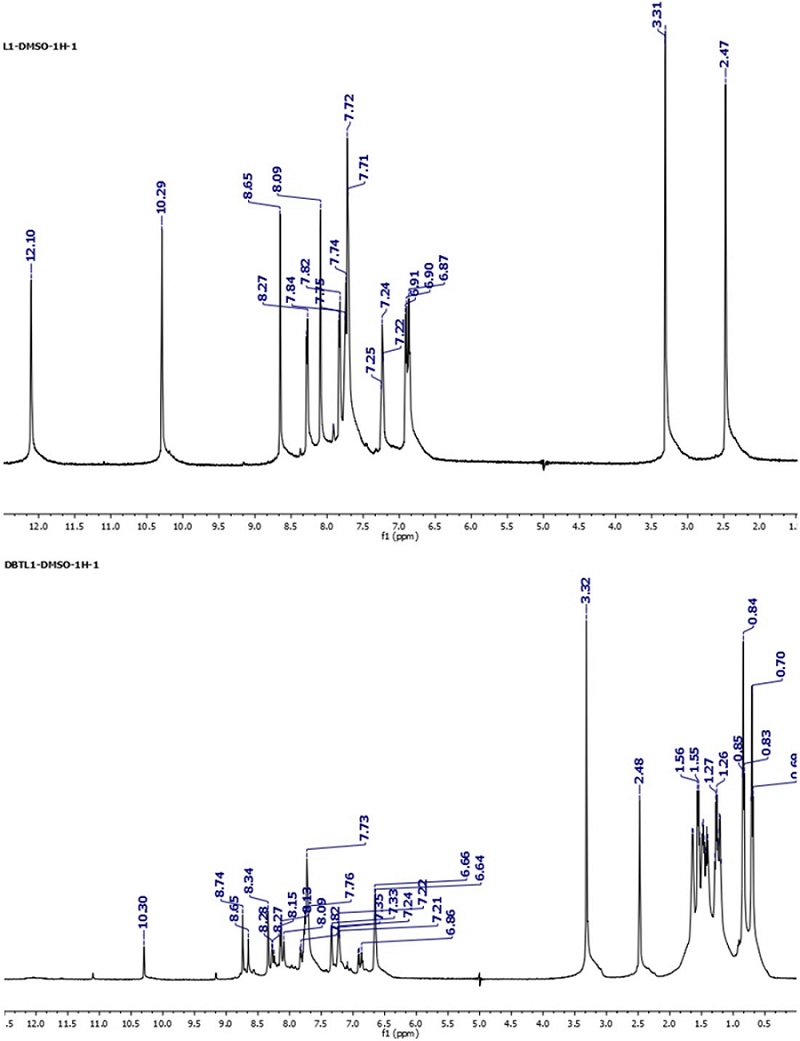
Figure 3:
1
H-NMR spectrum of L (above) and its complex (below).