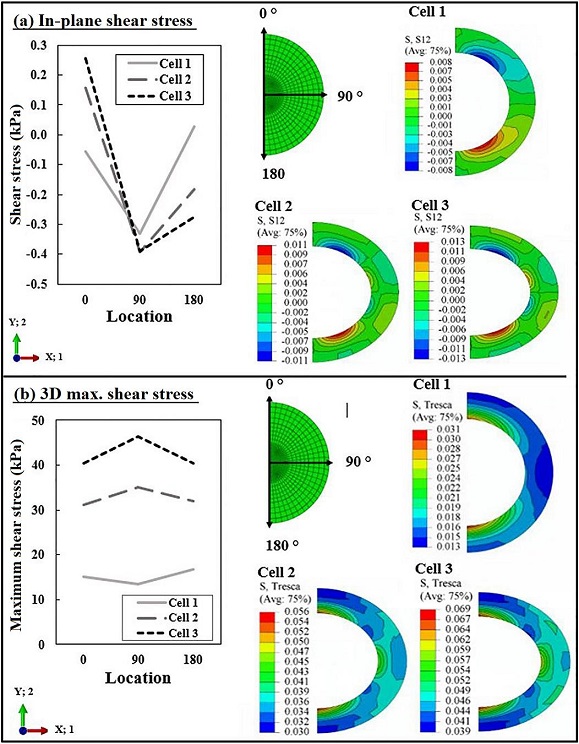
| Figure 6: Line graphs and contour plots of (a) in-plane shear stress and (b) 3D maximum (Tresca) shear stress within the PCM of cells in three locations in the RZ when subjected to 10% compression of growth plate cartilage. In-plane shear stresses and maximum shear stresses in the line plots were extracted at a radius of 7 μm corresponding to the distal tip of the cilium at three locations: 0, 90, and 180 degrees. Contour plots are in units of MPa. Cell 1 is located near the subchondral bone plate. Cell 2 is in the middle of RZ and Cell 3 is near the PZ. The outer radius of the PCM is 7.5 μm and the inner radius of the PCM is 5 μm. |