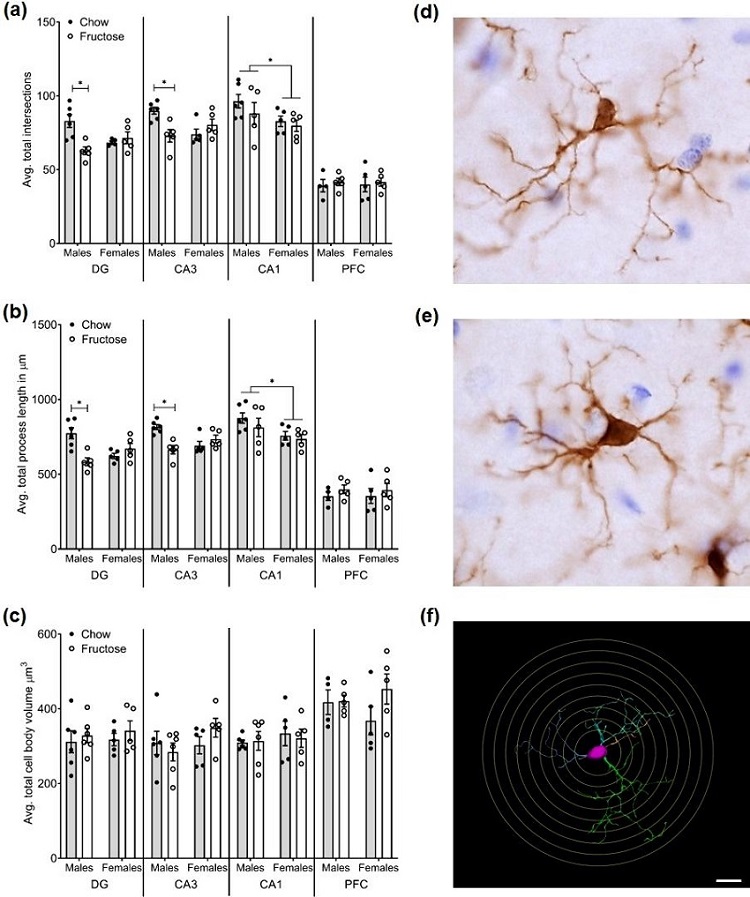
| Figure 2: Males fed a HFD showed more reactive microglia in the DG and CA3 regions of the hippocampus compared to chow-fed controls. (a) Total process intersections after Sholl analysis indicated that males fed a HFD had fewer intersections indicating less complex microglia processes compared to chow controls—indicative of a more reactive phenotype. Females showed fewer intersections than males in the CA1 region. (b) Total process length in the DG and CA3 was shorter in males fed a HFD compared to controls. Females again showed shorter process length in the CA1 region compared to males. (c) Total cell body volume was not altered by diet in either sex. No differences between any metrics were evident in the PFC. Bars represent mean ± SEM. ∗P < .05. Representative (d) ramified microglia and (e) reactive microglia. (f) Representative tracing and Sholl analysis of a microglia. Scale bar = 20 μm. |