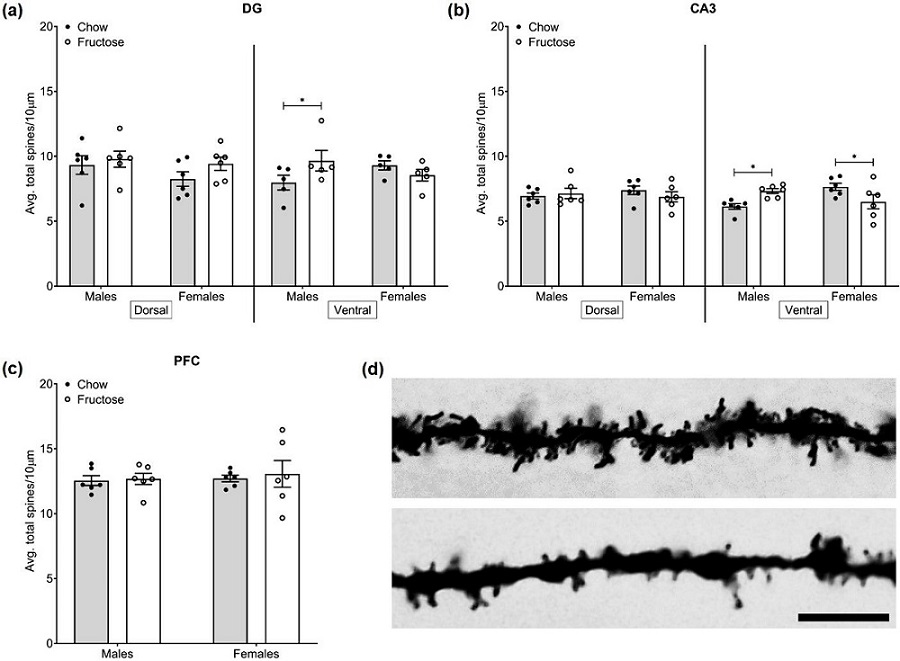
| Figure 4: Spine density was altered by a HFD in the ventral portions of the DG and CA3. (a) Spine density in the dorsal DG was unaltered by diet, but was increased in males in the ventral DG. (b) Spine density in the dorsal CA3 was unaltered by diet, but was altered in the ventral region. Males fed a HFD showed increased spine density, while females fed the HFD showed reduced spine density compared to chow-fed controls. (c) Spine density in the PFC was not altered by diet. Bars represent mean ± SEM. ∗P < .05. (d) Representative images of spines along a dendritic segment with a high density of spines (top) and low density of spines (bottom). Scale bar = 10 μm. |